ecdf#
- xarray_einstats.numba.ecdf(da, dims=None, *, npoints=None, **kwargs)[source]#
Compute the x and y values of ecdf plots in a vectorized way.
- Parameters:
- da
xarray.DataArray Input data containing the samples on which we want to compute the ecdf.
- dims
stror iterable ofstr, optional Dimensions over which the ecdf should be computed. They are flattened and converted to a
quantiledimension that contains the values to plot; the other dimensions should be used for facetting and aesthetics. The default is computing the ecdf over the flattened input.- npoints
int, optional Number of points on which to evaluate the ecdf. It defaults to the minimum between 200 and the total number of points in each block defined by dims.
- **kwargs
dict, optional Keyword arguments passed as-is to
xarray.apply_ufuncthroughsearchsorted.
- da
- Returns:
xarray.DatasetDataset with two data variables:
xandywith the values to plot.
Warning
New and experimental feature, its API might change.
Examples
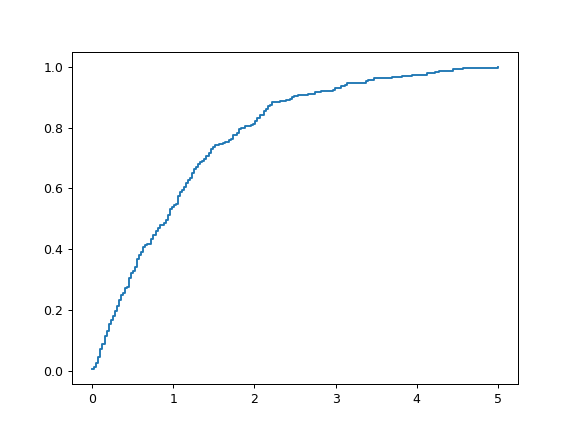
Compute and plot the ecdf over all the data:
from xarray_einstats import tutorial, numba
import matplotlib.pyplot as plt

ds = tutorial.generate_mcmc_like_dataset(3)
out = numba.ecdf(ds["mu"], dims=("chain", "draw", "team"))
plt.plot(out["x"], out["y"], drawstyle="steps-post");
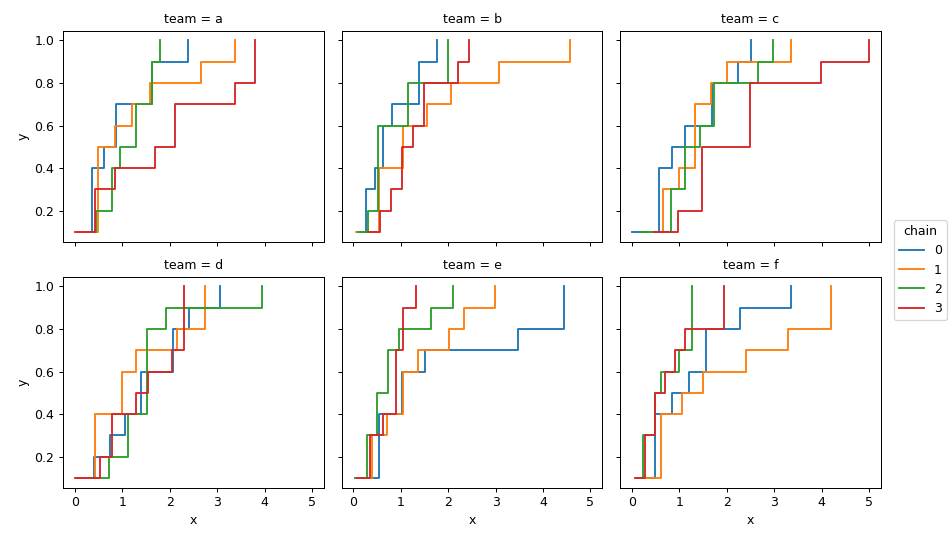
Compute vectorized ecdf values to plot multiple subplots and multiple lines in each with different hue:
out = numba.ecdf(ds["mu"], dims="draw")
out["y"].assign_coords(x=out["x"]).plot.line(
    x="x", hue="chain", col="team", col_wrap=3, drawstyle="steps-post"
);